Geo-IP maps
Python tool to generate maps from data stored in an Elasticsearch database or from a given CSV file.
elasticGeoIPMaps
This tool creates a choropleth map from data stored in an elasticsearch database or from data stored in a CSV file.
Is a draft tool so, it lacks some options about the elasticsearch connection, such as the host, port or SSL stuff. It assumes elasticsearch is running in localhost and port 9200. But the code can be easily changed looking at this example. I will try to add these options in the future if I have time, but, at the moment, I don’t require them for myself. Feel free to fork it or propose new changes.
Motivation
On an offline environment, solutions such as Kibana and the like cannot create the tile map owing to the lack of external internet connection. This offline solution makes use of an offline geo-ip databases available at ip2location. Currently, the database in use is the smallest of its kind, the ip-country database. Thanks to the choropleth maps from plot.ly we can create these maps offline. There is only one hack to be done. Read the section for more information.
Pre-requirements
python 2.x, pip
Set-up instructions
git clone https://github.com/carlosvega/elasticGeoIPMaps.git elasticGeoIPMaps
cd elasticGeoIPMaps
pip install virtualenv
virtualenv .env
source .env/bin/activate
pip install -r requirements.txt
Run an example
python create_map.py --file examples/example.csv --from $(date -d "2017/11/01 12:30" +%s) --value-field visits --agg-field client_ip --date-field date --dir test
This will create an HTML map and a CSV file:
test/geoip_converted.csv
test/geoip_map.html
Data requirements
-
The datatype of the IP field stored in the Elasticsearch database must be an IP datatype in order to get the integer representation of the IP addresses.
-
If a file is used instead, the column corresponding to the IP values must be filled with the integer representation of the IP addresses. An online tool to convert from IP to integer representation is available in the browserling website, but there are many offline tools and libraries to do so.
Make the rendering of the map offline
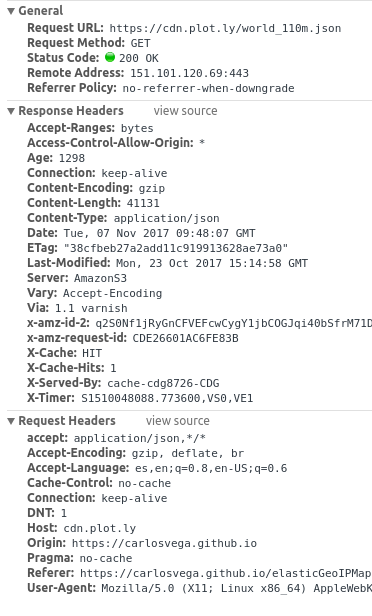
As depicted in the figure below, when the generated HTML file is opened through the browser, there is an HTTP network request to the plot.ly CDN in order to retrieve the borders that shape the map, defined in the file https://cdn.plot.ly/world_110m.json
The URL for this request is defined inside the HTML file. As seen in the next figure.
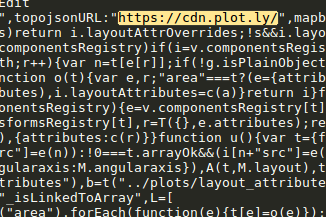
One workaround is, downloading the file from the cdn and putting it on your offline server. Then, replace the line in the HTML once is created. Like this.
sed -i 's@https://cdn.plot.ly/@http://your.domain.com/@g' map.html
This can be done for an hypothetical JavaScript version, replacing the CDN domain in the JavaScript version. I don’t know if this breaks any license agreement. I couldn’t find any copyright about that file. Notwithstanding, the plotly.js version has been open-sourced
Some comments about a JavaScript version
Developing this tool in JavaScript in order to run much of the process in the client side is no challenge at all. Is quite straightforward if you make use of plotly.js. I currently have a JavaScript version (a bit unclean). You just need to load the CSV file with the IP-country relationship table, retrieve the data from elasticsearch trhough elastic REST API and make a few data conversions in order to plot it. Is of course much faster than doing it on python. I will update this page if I decide to make the JavaScript version available for the public.